Data Guide
for
“The Economic Impacts of the Dispossession”
Chapter 10 of
Landscapes of Injustice:
A New Perspective on the Internment and Dispossession of Japanese Canadians
by
Jordan Stanger-Ross
Data Guide
for
“The Economic Impacts of the Dispossession”
Chapter 10 of
Landscapes of Injustice:
A New Perspective on the Internment and Dispossession of Japanese Canadians
by
Jordan Stanger-Ross
This site provides documentation of the data collection process and data files for the findings reported by Jordan Stanger-Ross in “The Economic Impacts.” Although users can jump to the data we strongly recommend reading the contextual information before attempting any analysis. Real estate data can be unwieldy and confusing.
Go straight to the Data Files section, where you can view or download the data.
Read chapter 10 entitled "The Economic Impacts of the Dispossession" (pdf).
The publisher's website contains an abstract, table of contents, reviews and information on purchasing.
Users who would like more information, or who would like advice in undertaking their own title searches, should contact Dr. Stanger-Ross at jstross@uvic.ca.
All data were collected from the Land Title and Survey Authority of British Columbia, which was a formal partner institution on the Landscapes of Injustice project. For this work, research assistants (students, working individually and as teams) were located on site at LTSA offices in New Westminster and Victoria. The LTSA provided support for RAs and granted them free access to their records. We also received the generous advice from independent title searchers, especially Rod King. The following documentation was created of the title search process:
Title information was entered into a custom-built database, created by Martin Holmes at the Humanities Computing and Media Centre in the Faculty of Humanities at the University of Victoria, in coordination with Jordan Stanger-Ross and students in the field. If you are interested in an empty version of the database for your use, please contact us. Users of the software are asked to provide attribution.
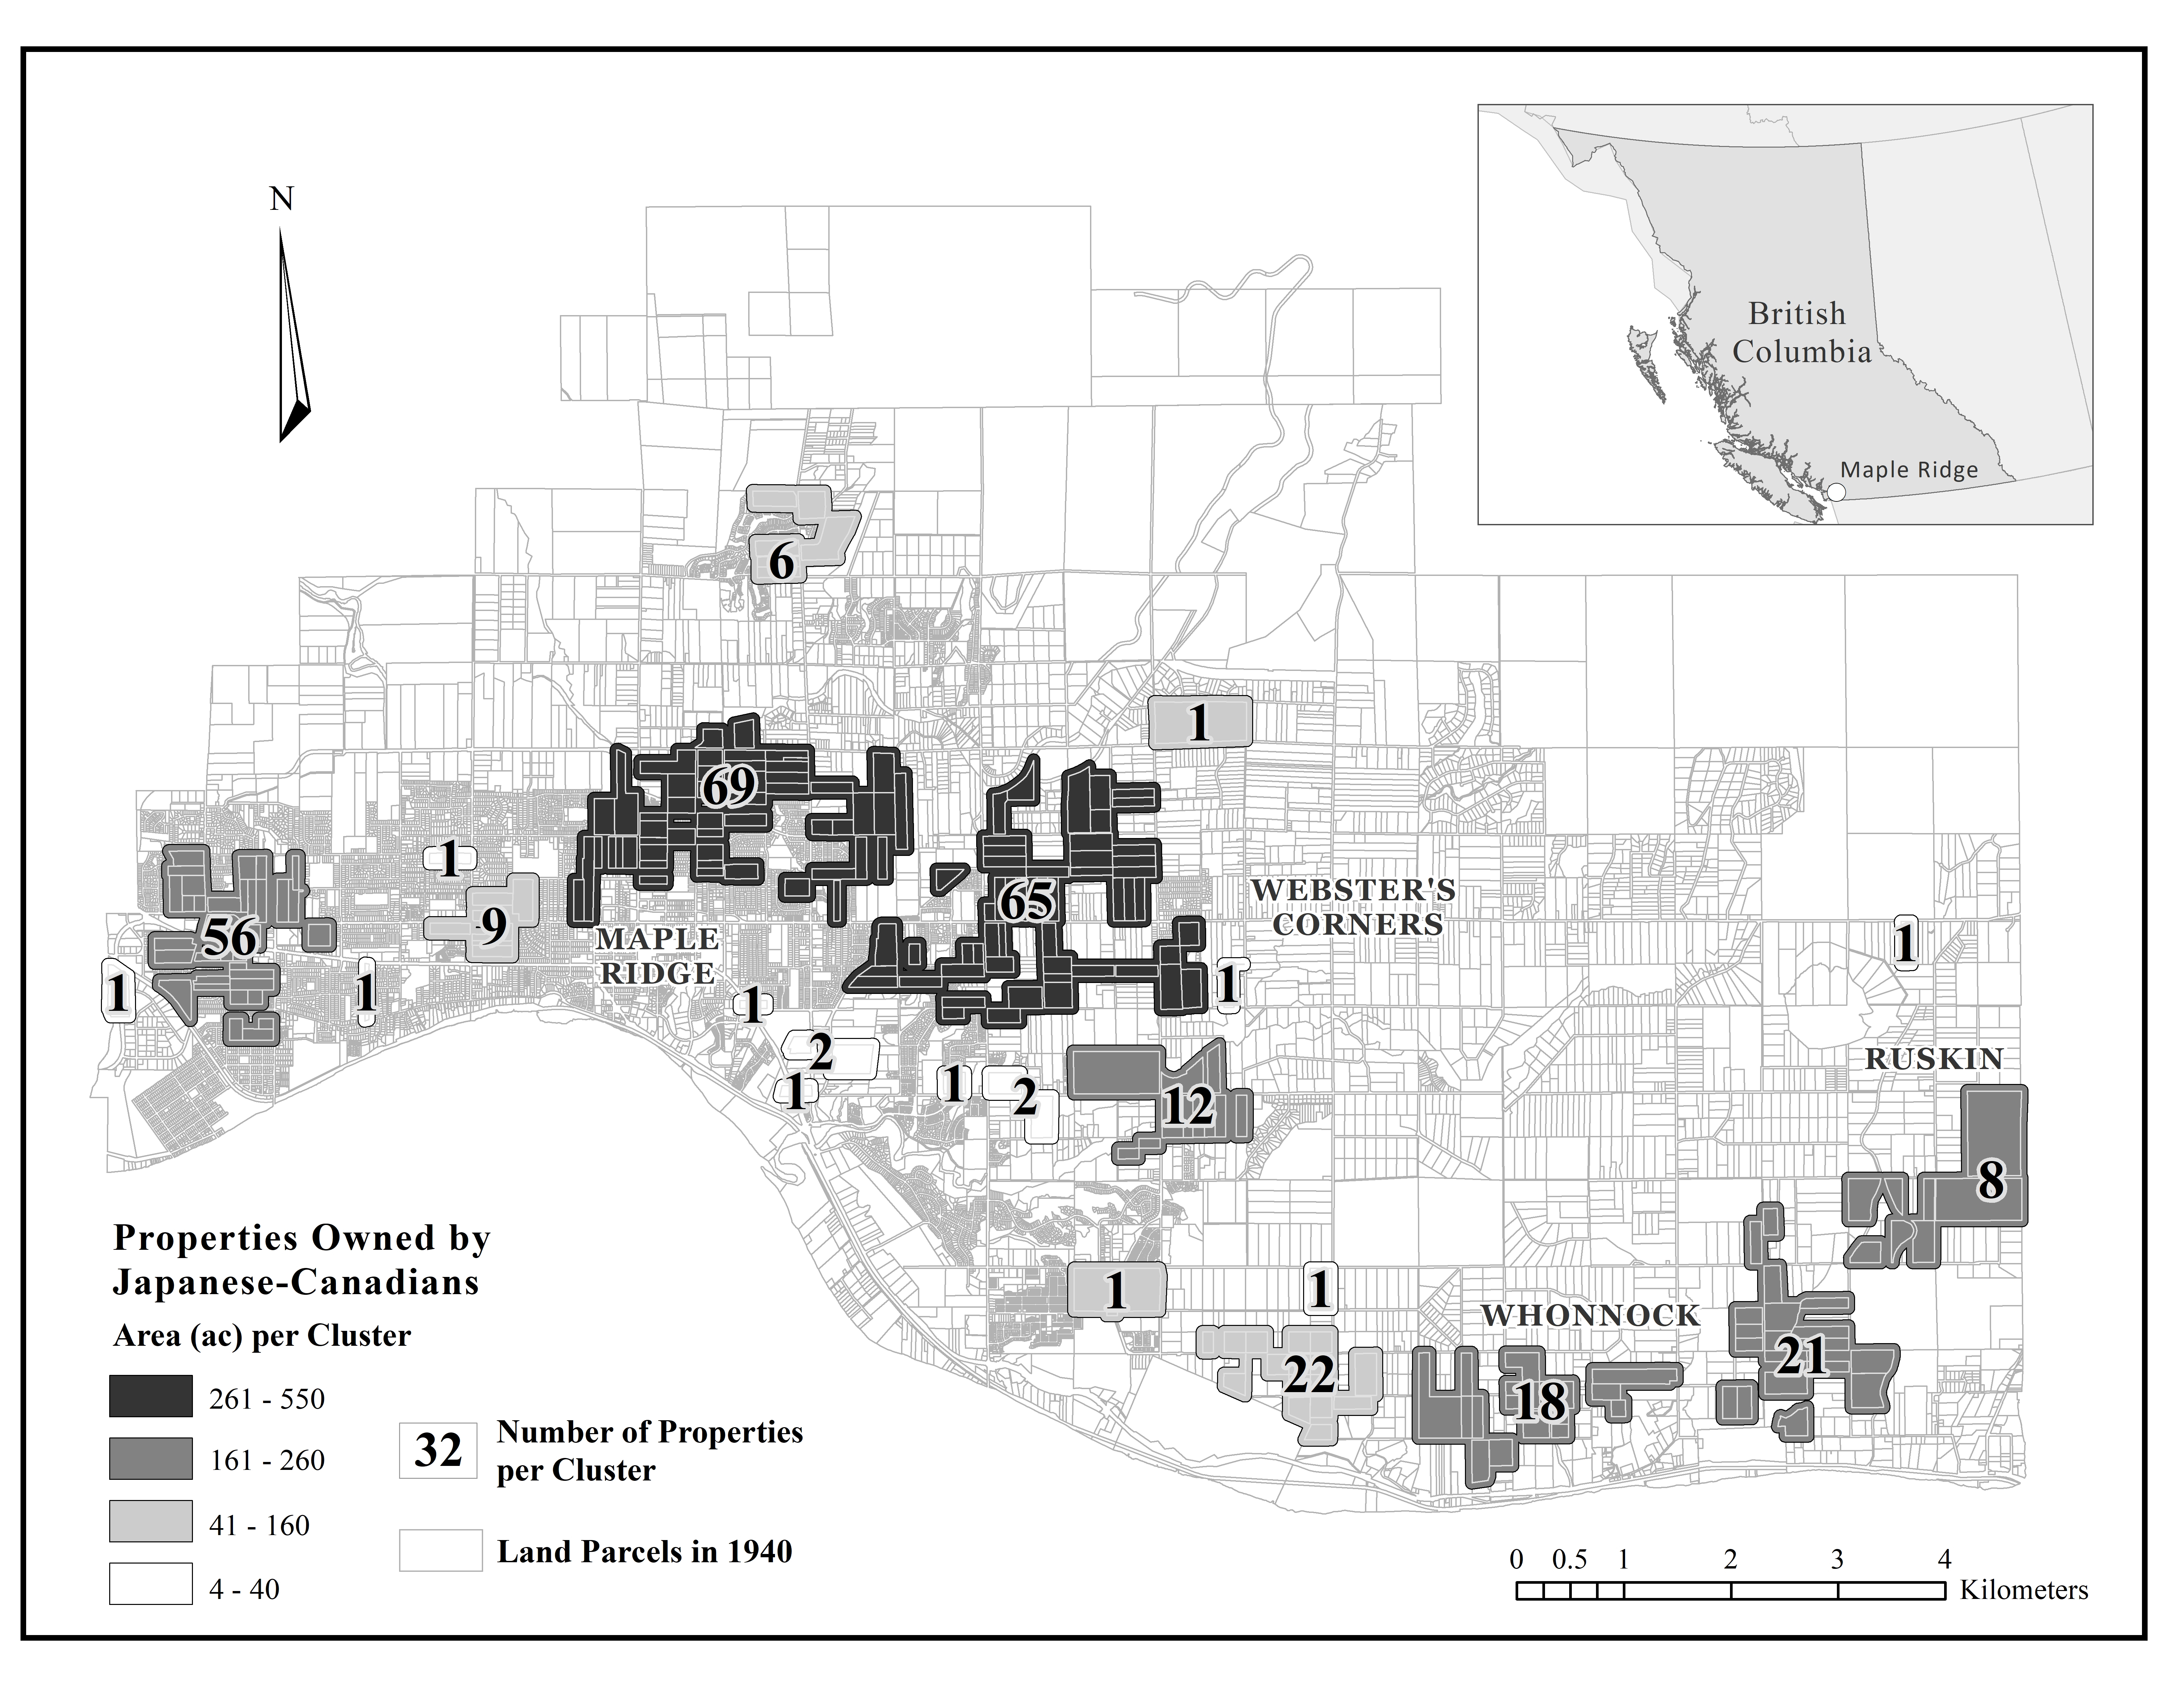
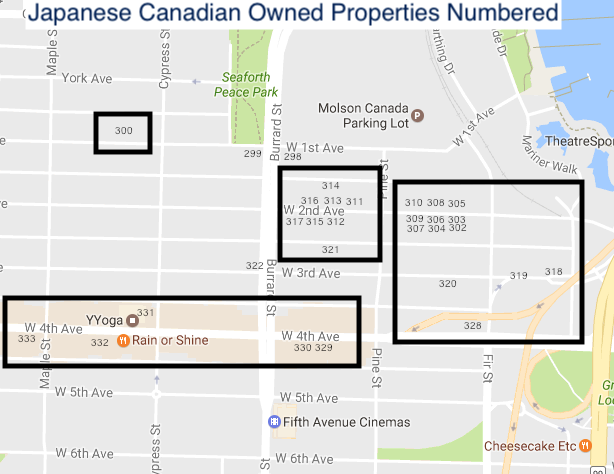
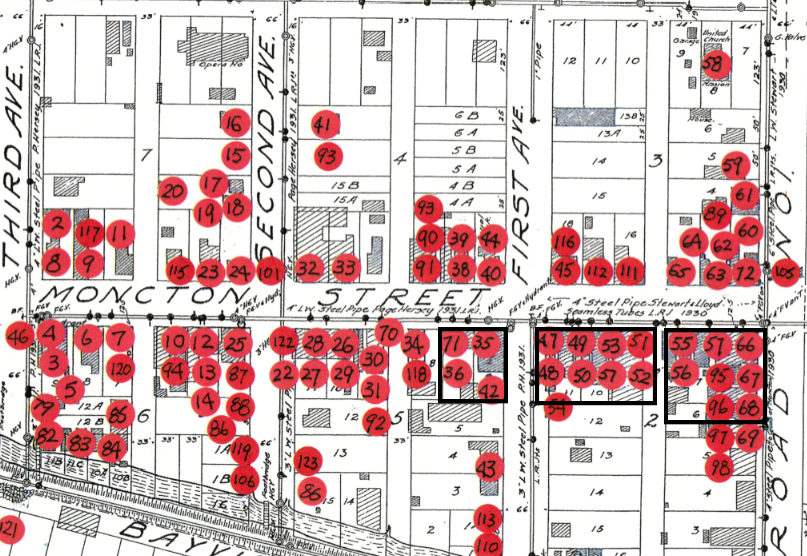
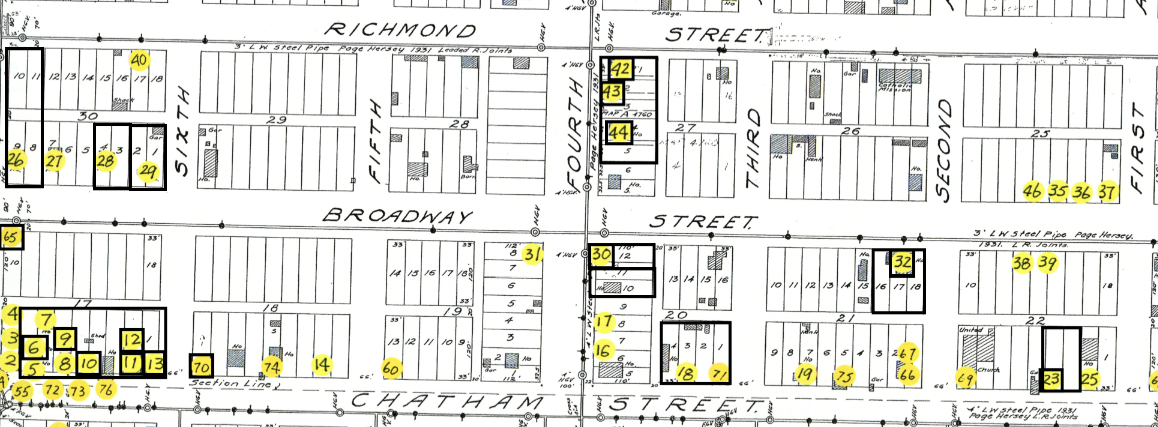
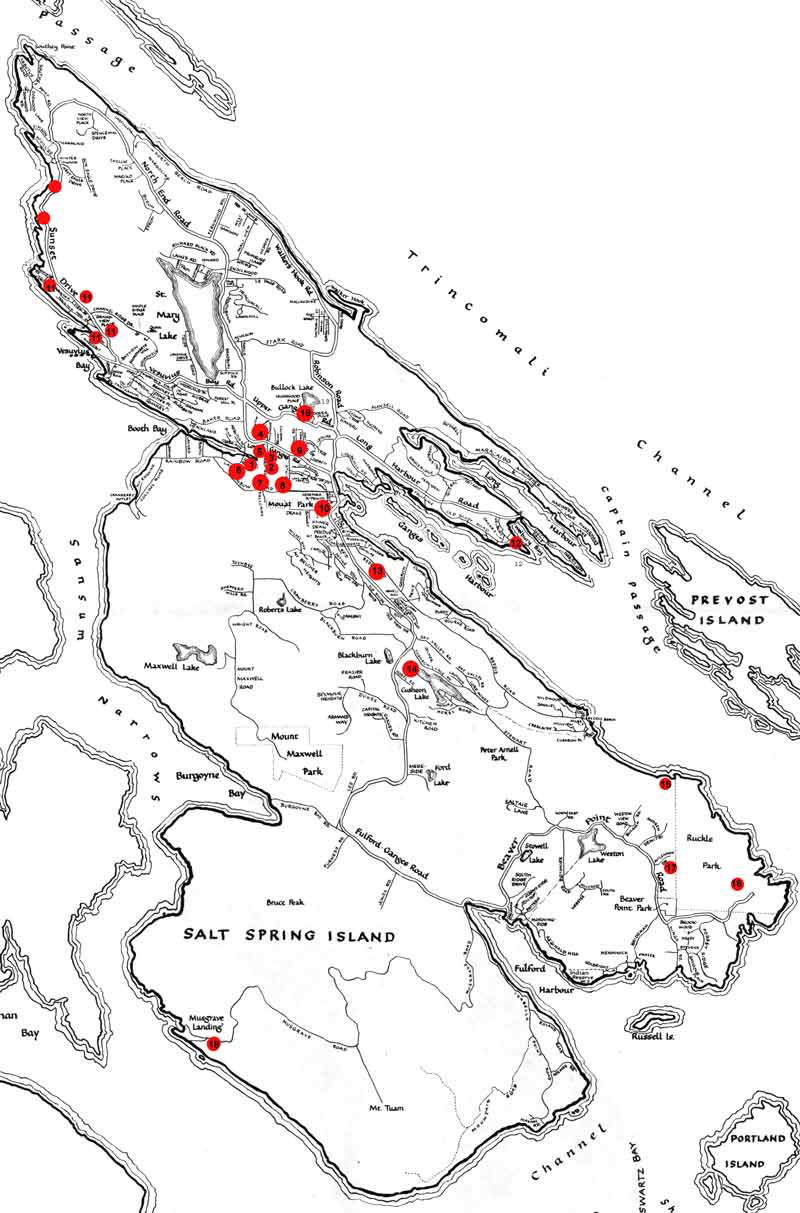
RAs searched land title histories in four important sites of Japanese Canadian life before the 1940s:
Due to time and resource constraints, these data sources are uneven. We were able to collect much more robust data for two of the sites: Vancouver’s Powell Street, where RAs searched all titles within a 23 square block area where Japanese Canadians represented more than 40 percent of the residential population in 1942 (as reported in city directory data), and Maple Ridge, where we were able to include a 69 Japanese-Canadian-owned farms (in 1942) and adjacent comparator properties each one (83). In our other sites of study, we were only able to collect data on Japanese-Canadian owners, and, as a whole, the data are less complete. In the chapter “Economic Impacts,” Stanger-Ross uses the data for Powell Street, Maple Ridge, and, secondarily, Salt Spring. Data from all sites, however, are included in the data files on this page.
Data collection by RAs was checked for accuracy at regular intervals. Our procedure involved taking a random sample from work previously completed by an RA and having another RA duplicate the search, and then results were compared and discussed by all. While this process is not fully documented in the attached files, some representative results have been included. As a result, we have a very high level of confidence in the data. Error rates were very low and superficial in nature.
A sample of accuracy testing documentation:
The files for analysis were generated from the real estate database by Martin Holmes in collaboration with Dr. Stanger-Ross. As reported in “Economic Impacts,” determining the “granularity” for analyses of real estate data requires choice among imperfect options. “Economic Impacts” takes two approaches.
Examining “fair market value,” where it is especially important to trace individual properties longitudinally over time, the chapter uses legally described lots, or parcels of real estate, as the unit of analysis.
It is important to note that individual “properties,” as colloquially understood and encountered in the world in the form of buildings, homes, or farms (for example), often occupy more than one legally described lot or parcel. In many cases therefore, a given lot (A) is packaged with others (B and C) in one or more transactions (say, when a large building is sold). Subsequently, if, for example, the building is demolished and a number of smaller edifices take its place, each of the lots might be sold individually. Further, any or all of the original lots can be packaged with still others (D, E, or F) in subsequent transactions. In addition, various forms of redevelopment result in the original lot (A) being extinguished, subdivided, and replaced by new legally described properties (1, 2, and 3), which might then be transacted together, separately, or in combination with other preexisting lots.
As a result, data analyses (and even database construction and management) required many long and complex deliberations between Martin Holmes, a programmer at the Humanities Media and Computing Centre, and Dr. Stanger-Ross. We chose to begin our longitudinal datasets with each legally described property, linking those with antecedent and descendent exchanges of properties that occupy the same geographic location (as determined by a protocol regarding geographic overlap as described in the Data Dictionary. Each row of data in these files represents a chain of transactions of lands in the same location.
As a result, in the analyses reported in this section, an individual transaction (of, say, lots A, B, and C conveyed together in one transfer) can appear three separate times within the three separate property histories of lots A, B, and C. The price agreed upon in a single transaction thus establishes the price for three different properties/lots. From the standpoint of statistical analyses this approach has drawbacks – ideally all individual rows of data would be completely independent of one another – but the reality of real estate transaction made this, in our view, the only feasible approach to tracing transaction histories over time.
“Economic Impacts” uses a data file organized by legally described lots especially in the “Fair Market Value” section, to compare the prices of real estate forced onto the market by the Custodian with the free market exchanges of the same era (1942-1949).
Other analyses, particularly in the “Choice, opportunity, and loss” section of “Economic Impacts,” use data files organized by ‘title’. In such files, each row of data represents an individual transaction. An individual transaction might include only one legally described lot (see above) or several. In the chapter, this data is used in analysis of the market as a whole by date, for example in figures 10.6-10.8. Note that, in these data files, properties that are frequently transacted appear more often than seldom transacted properties, and so have a disproportionate influence on the data. Therefore, these tables should be interpreted as representing the prices of properties being transacted on the market. Further, in the analyses presented in those figures, the total areas and prices paid are first summed, and then the price per square meter is calculated. Thus, those figures represent the average price of a square meter of land transacted at those dates. Larger lots (with many square meters) thus contribute more to the calculation than smaller lots.
Note that all analyses presented in “Economic Impacts” use constructed variables and various selection restrictions. For example, uses 8-year date ranges to present price data, because of the 8-year period (1942-1949), during which Japanese Canadians were excluded from the market. These constructed variables are not in the raw data provided on this site. Instead, users will have to construct variables that are suited to their own purposes. Similarly, all analyses in “Economic Impacts” uses various forms of data sub-selection. Price analyses, for example, exclude ‘nominal transactions’ (defined in the Data Dictionary) which might, for example, denote a transfer of ownership among business partners or within a family, rather than a market transaction whose price gives a sense of the market circulation of property. Users of the data are encouraged to select appropriate sub-selections when using the data, based on their needs and interests.
| Data | Available as | ||
| Explanation of field names | |||
| Property Statistics Data by Lot | XML | spreadsheet | |
| Property Statistics Data by Title | XML | spreadsheet | |
On page 355 of Landscapes of Injustice, the N for figure 10.6 is incorrectly reported. The correct numbers are: N= 1516 (1918-1925=91; 1926-1933=128; 1934-1941=97; 1942-1949=440; 1950-1957=262; 1958-1965=140; 1966-1973= 211; 1974-1981=147).
Many thanks to Stewart Arneil, Greg Newton, and especially Martin Holmes at Uvic's Humanities Computing and Media Centre for many hours of programming support.
Our fearless land title searchers were: Jacopo Miro, Rebecca Mott, Sarah Catterall, Rebeca Salas, Ariel Merriam, Alissa Cartwright, Anna Gooding, and Mikayla Tinsley.
Thanks also to the LTSA (Land Title Survey Authority) staff, particularly in New Westminster, were our searchers spent many hours of research.